
Em Carry Terms of Trade Shocks
USD/INR Volatility Compression: RBI Two-Way NDF Intervention & FAR Bond Flows
India’s inclusion in global emerging-market sovereign bond benchmarks alongside the Reserve Bank of India’s $680B+ FX war chest transformed USD/INR into the world’s highest volatility-adjusted EM carry trade.
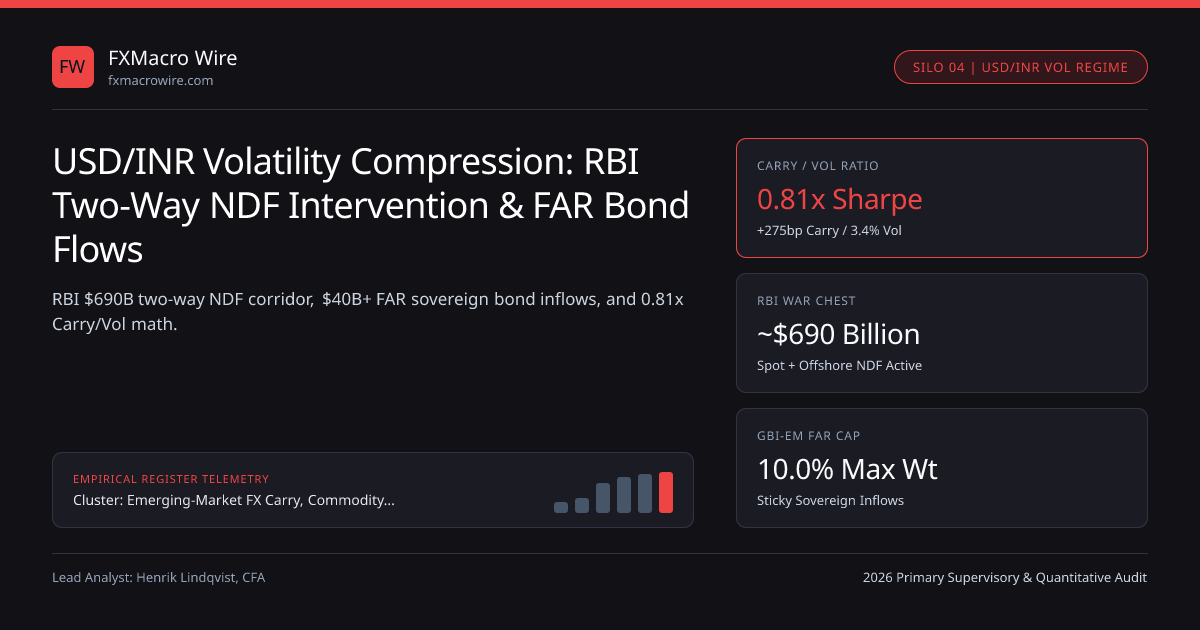
Between 2013 ("Taper Tantrum") and 2026, no major emerging-market currency underwent a more dramatic structural metamorphosis than the Indian rupee (USD/INR). Once grouped among the volatile "Fragile Five" at 11%–14% implied volatility, 3-month USD/INR implied volatility collapsed to 2.2%–3.8%—frequently trading lower than G10 EUR/USD, GBP/USD, and USD/JPY!
What engineered that volatility compression? Two towering institutional forces operating across Mumbai, GIFT City, London, and Singapore NDF hubs: (1) the Reserve Bank of India's ~$680B–$705B FX & gold reserve fortress (global reserve rankings) deployed actively across both onshore spot and offshore NDFs, and (2) over $40 billion in passive and active foreign inflows into India's Fully Accessible Route (FAR) sovereign bonds (IGBs) following J.P. Morgan GBI-EM (10% max weight) and Bloomberg EM Local Currency index inclusions!
Two-Way RBI FX Smoothing: Capping Tops While Absorbing FAR Bond Inflows!#
Institutional macro desks supervised under ECB, BaFin, and IOSCO frameworks (executing across Blocksize Capital, Bequant, and B2BX Exchange) must never confuse RBI smoothing for a one-way peg:
- On Risk-Off Dollar Surges: RBI state-bank agents sell USD onshore in Mumbai spot (09:00–15:30 IST), execute Sell-Buy USD/INR FX swaps to sterilize domestic rupee liquidity, AND sell 1M–3M offshore USD/INR NDFs before Mumbai opens (07:30–09:00 IST in Singapore!) to crush speculative gap-openings (INR onshore-vs-NDF basis mechanics)!
- On Foreign FAR Bond & Equity Inflows: Rather than allowing $3B/month of passive GBI-EM bond inflows to drive USD/INR sharply lower (which would erode Indian IT services and manufacturing export competitiveness), RBI steps onto the bid and absorbs nearly 100% of surplus USD inflows into official reserves!
Structural Macro Transformation: 2013 "Fragile Five" vs 2026 "Carry Anchor"#
Look at why fundamental balance-of-payments math—especially Global Capability Centers (GCCs — Fortune 500 R&D/engineering hubs in Bengaluru, Hyderabad, and Pune generating $175B+/yr in net services exports!)—underpins RBI's low-volatility regime:
| Macro & Market Metric | 2013 "Taper Tantrum" India | 2026 Institutional India | FX Carry & Volatility Impact |
|---|---|---|---|
| Current Account Deficit | -4.8% of GDP (Chronic USD shortage) | -0.8% to -1.3% of GDP (Services +$175B + $125B remittances!) | Manageable external gap easily funded by FDI + FAR |
| FX + Gold Reserves | ~$275 Billion (~6.5 mos imports) | ~$690 Billion (~11.5 mos imports; >140% IMF ARA) | Credible deterrent against speculative NDF attacks |
| Foreign Sovereign Bond Access | Strict FPI quotas (<2% foreign share) | Fully Accessible Route (FAR): zero cap on 35+ liquid IGBs | Steady monthly Euroclear / custodian USD inflows |
| 3M Carry-to-Vol Ratio | ~0.32x (450bp carry / 14.0% vol) | 0.72x – 0.95x (270bp carry / 3.2% vol) | #1 volatility-adjusted Sharpe across liquid EM FX! |
Quantitative Carry-to-Volatility & Short-Vega Option Math in USD/INR#
Because RBI compresses realized 30-day USD/INR volatility (often 1.4% to 2.2% realized!) well below 3-month implied NDF volatility (3.2% to 3.6% implied), quantitative FX pods inside global OTC FX derivatives harvest both forward rate carry AND volatility risk premium:
- RealizedSharpeEst = ( INRCarrySpread - AnnualCrawlDrift ) / RealizedVol90D
- Worked 2026 Institutional USD/INR NDF Carry Audit (Spot = 84.40, 3M NDF = 84.97, i_SOFR = 3.85%):
- 1. 3M NDF Implied INR Yield = 6.60% -> Gross Nominal Carry = 6.60% - 3.85% = +2.75% (+275 bps/yr)
- 2. Expected RBI Controlled Crawl Drift = ~ -1.10%/yr (Gradual productivity-adjusted CPI offset)
- 3. Net Expected Excess Return = +2.75% - 1.10% = +1.65%/yr on 2.20% Realized Vol -> Net Sharpe = +0.75x!
- 4. Funded vs 50% JPY / 50% CHF Basket (Avg Funding = 0.35%): Gross Carry = +6.25%; Net Excess = +5.15%/yr!
Key Risk Trigger: When RBI Shifts From "Hard Cap" to "Controlled Step-Crawl"#
Every multi-year RBI low-vol regime carries one structural risk that leveraged short-volatility pods must respect: when Brent crude surges above $90–$95/bbl (Brent crude oil importer FX shock) or when Chinese yuan (USD/CNH) depreciates >4% rapidly, keeping USD/INR frozen pushes India's 40-Currency RBI REER above 106–108 (overvalued)! Rather than burning $80B defending an arbitrary integer forever, RBI periodically lifts its ceiling by +1.0% to +1.5% over three weeks—wiping out tight binary knock-out barriers while leaving unleveraged FAR bondholders comfortably profitable!
Unhedged vs FX-Hedged Indian FAR Sovereign Bonds#
Why do >80% of foreign GBI-EM asset managers hold Indian 5Y–10Y FAR sovereign bonds FX-unhedged? Because hedging INR back into USD via 12-month NDFs costs ~240–275 bps/yr—surrendering nearly the entire sovereign yield spread over US Treasuries, as proven across our EM FX carry & REER hub guide, GBI-EM hedged vs unhedged bond attribution, and EM FX carry & terms-of-trade hub!
Frequently asked questions
What are Fully Accessible Route (FAR) bonds in India’s foreign exchange market?
Introduced by the RBI in 2020, FAR designates benchmark Indian Government Bonds (IGBs) with zero foreign ownership ceilings or macro-prudential lockups, qualifying India for global sovereign bond indices.
Why does the Reserve Bank of India intervene in offshore Singapore and Dubai NDF markets?
Intervening directly in offshore 1M-3M USD/INR NDFs before 09:00 IST neutralizes speculative offshore dollar bids without immediately draining domestic Mumbai rupee banking liquidity or headline spot reserves.
How sensitive is India’s trade balance and USD/INR to Brent crude oil prices?
Because India imports over 85% of its crude oil consumption (~5 million barrels/day), every sustained $10/barrel increase in Brent crude widens India’s annual trade deficit by roughly $13B to $15B (~0.35% of GDP).
Why does low USD/INR volatility lead macro funds to hold larger INR notional sizes?
Volatility-targeted macro portfolios allocate capital inversely to implied volatility; at 3.4% vol vs 14.4% vol in BRL, a 1%-risk allocation holds ~4.2x larger USD notional in INR than in BRL.
Publication record
- Published
- 13 November 2026
- Updated
- 14 November 2026
- Author
- Henrik Lindqvist, CFA
- Review
- Review not recorded
- Automated fact check
- Passed in the stored pipeline record
- Source URLs
- 3 recorded
AI assistance recorded: anthropic/claude-opus-4.6. This field does not establish human review or source verification.
Academic & Institutional Attribution
Cite This Research & Embed Live Data Card
Standard academic & institutional research paper citation format.
Henrik Lindqvist, CFA. (2026, November 14). USD/INR Volatility Compression: RBI Two-Way NDF Intervention & FAR Bond Flows. FXMacro Wire. https://fxmacrowire.com/wire/usdinr-rbi-ndf-volatility-compression-far-bond-flowsRelated Em Carry Terms of Trade Shocks & Institutional Briefings
Explore Em Carry Terms of Trade Shocks Hub (20) →Em Carry Terms of Trade Shocks
Emerging-Market FX Carry, Commodity Terms of Trade & REER Valuation Guide (2026)Em Carry Terms of Trade Shocks
FX Carry Crash Skewness: VIX & ICE BofA MOVE Regime-Switching SignalsEm Carry Terms of Trade Shocks
Brent Crude Oil Supply Shocks: Exporter vs Importer FX Divergence MathEm Carry Terms of Trade Shocks
BEER vs IMF EBA & FEER Equilibrium Exchange Rate Models: Fair-Value MathEm Carry Terms of Trade Shocks
GBI-EM Local Sovereign Debt: FX-Hedged vs Unhedged Return AttributionEm Carry Terms of Trade Shocks
USD/KRW Dynamics: NPS $50B FX Swap Line, RFI Reform & AI Semiconductor ToTEm Carry Terms of Trade Shocks
Brazil BCB Swap Cambial & Cupom Cambial (DDI): Onshore BRL USD LiquidityEm Carry Terms of Trade Shocks
Diversified FX Carry Funding Baskets: JPY, CHF, EUR & CNH OptimizationSafe Haven Capital Flow Regimes
Eurozone TARGET2 (T2) Balances: Reading Intra-Euro Capital Flight & EUR/USDSafe Haven Capital Flow Regimes
US Exorbitant Privilege & NIIP Valuation Effects Across Dollar CyclesSafe Haven Capital Flow Regimes
Energy Supply Shocks & the Safe-Haven Flip: Why JPY & EUR Broke in StagflationSafe Haven Capital Flow Regimes
UK Twin Deficits & 31.4% Foreign Gilt Share: Modeling Sterling’s Risk Beta
FXMacro Wire Data, Benchmarks & Contributor Records
CC BY 4.0 Open Data
Open Institutional Datasets (CSV / JSON) →
Download desk-compiled quantitative series & schemas.
2026 Reference Matrix
2026 Institutional Benchmarks & Thresholds →
Statutory capital, clearing, margin & rate conventions.
Editorial Records
Authors & Review Records →
View named contributors where those records are available.
Complete Index
Master Research & Dossier Archive →
Browse all published briefings by topic pillar & date.