
Safe Haven Capital Flow Regimes
Energy Supply Shocks & the Safe-Haven Flip: Why JPY & EUR Broke in Stagflation
For forty years, every global geopolitical panic automatically rallied the Japanese yen—until the 2022–2026 energy era proved that stagflationary oil and LNG supply shocks crown energy-independent USD and hydro-nuclear CHF while crushing fossil-fuel importers.
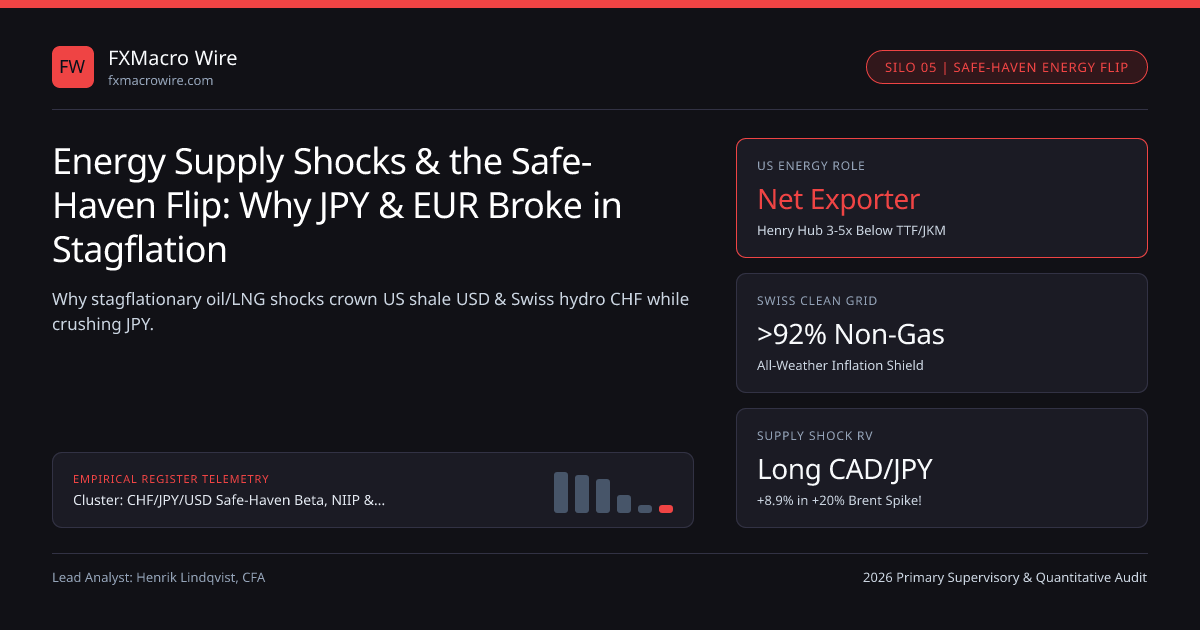
Between 1980 and 2019, institutional FX correlation matrices treated one empirical rule as iron law: whenever geopolitical headlines, Middle East tensions, or European security crises spiked global volatility, you bought Japanese yen (USD/JPY dropped!). Then in 2022—and repeatedly during subsequent Middle East shipping and energy scares through 2026—macro portfolios hedging equity risk via long JPY suffered a devastating double loss: global stocks fell AND the yen plunged -20% simultaneously, while DXY and CHF surged to generational highs!
What broke forty years of safe-haven orthodoxy? Two physical balance-of-payments revolutions audited across ECB, BCBS / BIS, and FINMA macro research (traded across institutional desks at Blocksize Capital, Credit Suisse / UBS, and CMC Central): (1) the US Permian Shale + Gulf LNG Boom turned the world's reserve issuer into a net energy exporter, while (2) post-Fukushima nuclear offline capacity + Russian pipeline gas loss left Japan and continental Europe exposed to $30+/MMBtu spot LNG and $95+ Brent crude!
Conditional Correlation Matrix: Demand Shock vs Energy Supply Shock!#
Never ask "What is JPY's correlation to VIX?" without conditioning on the sign of Energy Prices AND US 10Y Treasury Breakevens:
- Demand / Financial Credit Shock (2008 Lehman, Mar 2020 COVID, Aug 2024 Carry Unwind): Global aggregate demand collapses -> Brent crude plunges -30% AND US 10Y yields plunge -80 bps -> Japan's energy import bill shrinks at the exact same moment US-Japan rate differentials compress -> JPY is the #1 performing currency on Earth!
- Energy / Commodity Supply Shock (2022 Gas Crisis, Strait of Hormuz / Red Sea Disruptions): Fossil-fuel supply tightens -> Brent crude & JKM/TTF LNG spike +35% AND central banks hike rates to fight inflation (US 10Y yields rise +60 bps!) -> Japan's trade balance swings into a ¥20T cash deficit while the Bank of Japan lags Fed/ECB hikes -> JPY turns into the WORST G10 currency, while USD and hydro-nuclear CHF dominate!
G10 Energy Self-Sufficiency & Monetary Reaction Matrix#
Look at why even EUR/JPY—despite Europe's own energy vulnerability—climbed to historic highs above 170 during energy inflation waves: because the ECB hiked €STR +450 bps aggressively against headline HICP while BoJ kept TONA near zero!
| G10 Safe-Haven Candidate | Net Primary Energy Balance (% GDP) | Electricity Generation Shield | Central Bank Supply-Shock Reaction | Stagflation Safe-Haven Grade |
|---|---|---|---|---|
| Swiss Franc (CHF) | Modest oil import (-1.1% GDP) | 92%+ Hydro & Nuclear (Zero gas power!) | SNB sells FX reserves actively to block imported CPI! | A+ (Best All-Weather Haven) |
| US Dollar (USD) | +0.6% to +1.2% GDP Net Exporter | Domestic cheap Henry Hub gas ($2.50-$3.50!) | Fed hikes aggressively; high real SOFR attracts global cash | A+ (Best Liquidity & Yield Haven) |
| Euro (EUR) | -2.4% to -4.5% GDP importer | Growing renewables/nuclear vs expensive TTF LNG | Single-mandate ECB hikes €STR to defend 2% HICP | C+ (Hurts vs USD/CHF; beats JPY) |
| Japanese Yen (JPY) | -4.2% to -5.8% GDP importer | ~70% imported LNG/coal thermal generation | Cautious BoJ lags Fed/ECB -> real TONA deeply negative | D- (Fails in Energy Supply Shocks!) |
Quantitative Safe-Haven Beta Decomposition (State-Contingent VIX x Oil Interaction)#
Institutional multi-asset risk managers replace static historical covariance matrices with a State-Contingent Interaction Model so equity tail hedges never backfire during commodity supply shocks:
- Delta ln(USDCHFt) = -0.26 * DeltaVIXt - 0.04 * ( DeltaVIXt * I(DeltaBrent > +10%) ) + 2.8 * Deltay10Y_UST
- Worked Portfolio Tail-Hedge Proof (+10 Pt VIX Geopolitical Oil Shock: Brent +20%, US 10Y Yield +25 bps):
- 1. Naive Yen Hedge (Short USD/JPY):
- E[ Delta USD/JPY ] = -0.38(10) + 0.52(10) + 6.4(+0.25) + 0.24(+20) = -3.8% + 5.2% + 1.6% + 4.8% = +7.80% USD/JPY JUMP! (Long JPY LOSES -7.8%!)
- 2. All-Weather Franc/Dollar Hedge (Long CHF/EUR or Long USD/EUR):
- CHF/EUR rallies +2.9% and USD/EUR rallies +3.6%—delivering positive crisis convexity when equities drop!
Structural US Advantage: $3 Henry Hub Gas vs $11–$14 European TTF & Asian JKM LNG!#
Notice why energy shocks create multi-year industrial FDI divergence (Broad Basic Balance FDI flows), not just 2-week trade-bill blips: because US shale gas remains partially landlocked before liquefaction, US industrial chemical, fertilizer, steel, and AI data-center power users pay ~$3.00/MMBtu at Henry Hub, while European and Japanese competitors pay $11–$14/MMBtu for imported seaborne LNG (liquefaction + tanker + regasification markup!)—pulling billions of greenfield industrial capex into US dollars!
Multi-Asset Portfolio Hedging Rule for 2026 and Beyond#
Across our safe-haven FX & BoP hub guide, Swiss franc pharmaceutical & hydro mechanics, and Japan’s cash energy/digital deficit, institutional CIOs split currency tail-hedges into two specialized sleeves: own JPY calls (USD/JPY puts) strictly to hedge deflationary US recession / credit-crunch risk, and own USD & CHF calls (EUR/USD & EUR/CHF puts) to hedge geopolitical supply & inflation shocks across our safe-haven FX & capital-flow regimes hub!
Frequently asked questions
Why did the Japanese yen rally after the 2011 Tohoku earthquake despite nuclear shutdowns, yet fall in 2022?
In March 2011, US Federal Reserve rates were pinned at 0.00% (no US-Japan yield gap!) and domestic insurers expected yen repatriation claims—until G7 joint intervention capped JPY, after which rising LNG imports pushed USD/JPY from 76 to 125 over 2012-2015!
Why did the Swiss franc hold up during the 2022 European energy crisis when the Euro plunged below parity?
Over 92% of Switzerland’s electricity comes from domestic Alpine hydropower and nuclear plants (near-zero natural gas power generation), keeping Swiss CPI at 3.5% vs 10.6% in the Eurozone.
How do Japanese nuclear reactor restarts change JPY’s safe-haven behavior?
Each restarted 1-GW nuclear reactor displaces roughly ¥150B-¥200B/year of imported LNG; restarting 18-22 reactors progressively reduces Japan’s automatic spot USD buying during global gas spikes.
Which single currency pair best hedges a Middle East Strait of Hormuz oil supply disruption?
Long CAD/JPY or Long NOK/JPY—pairing an OECD energy exporter with rising central bank rate expectations directly against a 100%-crude-importing low-yielder.
Publication record
- Published
- 13 November 2026
- Updated
- 15 November 2026
- Author
- Henrik Lindqvist, CFA
- Review
- Review not recorded
- Automated fact check
- Passed in the stored pipeline record
- Source URLs
- 3 recorded
AI assistance recorded: anthropic/claude-opus-4.6. This field does not establish human review or source verification.
Academic & Institutional Attribution
Cite This Research & Embed Live Data Card
Standard academic & institutional research paper citation format.
Henrik Lindqvist, CFA. (2026, November 15). Energy Supply Shocks & the Safe-Haven Flip: Why JPY & EUR Broke in Stagflation. FXMacro Wire. https://fxmacrowire.com/wire/energy-supply-shocks-terms-of-trade-safe-haven-flipRelated Safe Haven Capital Flow Regimes & Institutional Briefings
Explore Safe Haven Capital Flow Regimes Hub (20) →Safe Haven Capital Flow Regimes
G10 Safe-Haven FX Beta, NIIP & Balance-of-Payments Capital Flow Guide (2026)Safe Haven Capital Flow Regimes
UK Twin Deficits & 31.4% Foreign Gilt Share: Modeling Sterling’s Risk BetaSafe Haven Capital Flow Regimes
CFTC TFF FX Positioning: Leveraged Funds vs Asset Managers & Pain TradesSafe Haven Capital Flow Regimes
Global M2 Liquidity Impulse & Central Bank Reserves: High-Beta AUD, NZD & SEKSafe Haven Capital Flow Regimes
Cross-Border M&A Deal-Contingent FX Forwards: Pricing Regulatory Tail RiskSafe Haven Capital Flow Regimes
Solvency II 25% FX Capital Charge: Why European Insurers Hedge 95% of USDSafe Haven Capital Flow Regimes
FX 25-Delta Risk Reversals & Butterflies: Reading Safe-Haven Tail SkewSafe Haven Capital Flow Regimes
Sovereign Wealth Fund & Petrodollar Recycling: ADIA, PIF, QIA & NBIM FX FlowsDigital Currencies
Piero Cipollone: Cash and the digital euro: two sides of the same coinMarket Insights
Yuan Rally Likely to Cool, Not ReverseMarket Insights
Singapore Central Bank Rolls Out Gold-Vaulting ServicesEarnings Reports
CJ CheilJedang Q3 2026 slides: sales rise 5.7%, FX losses hit profit
FXMacro Wire Data, Benchmarks & Contributor Records
CC BY 4.0 Open Data
Open Institutional Datasets (CSV / JSON) →
Download desk-compiled quantitative series & schemas.
2026 Reference Matrix
2026 Institutional Benchmarks & Thresholds →
Statutory capital, clearing, margin & rate conventions.
Editorial Records
Authors & Review Records →
View named contributors where those records are available.
Complete Index
Master Research & Dossier Archive →
Browse all published briefings by topic pillar & date.