
Safe Haven Capital Flow Regimes
US Treasury TIC Form SLT Flows: FX-Hedged vs Unhedged UST & Equity Demand
Every month, financial headlines misread the US Treasury International Capital (TIC) report—confusing custodial Cayman/Luxembourg bookings for sovereign dumping and overlooking whether foreign Treasury purchases were 100% FX-hedged via swaps.
Around the 15th to 18th of every month at 16:00 ET, the US Department of the Treasury releases its Treasury International Capital (TIC) monthly cross-border securities dataset (with a ~6-week lag). Within minutes, social media and retail news wires scream alarming headlines like "Japan or China Dumped $35 Billion of US Treasuries!"—predicting an imminent collapse in DXY.
Institutional G10 FX strategists and central bank reserve auditors (ECB, BCBS / BIS, CSSF Luxembourg, and CBI Ireland, advising macro desks across Blocksize Capital, Bequant, and Bolero) know three fundamental reasons why raw TIC headlines fail as spot FX signals—unless you apply Valuation Deflators, Custodial Look-Throughs, and FX-Hedge-Ratio Adjustments!
Legacy TIC Form S (Transactions) vs Modern TIC Form SLT (Monthly Holdings)!#
First, understand how the US Treasury modernized TIC architecture:
- Historically, monthly Form S tracked gross cross-border purchases minus sales (notoriously distorted because principal paydowns on maturing T-Bills and MBS weren't captured cleanly!).
- Today, institutional researchers prioritize TIC Form SLT (Aggregate Holdings of Long-Term Securities by Foreign and US Residents) combined with the Federal Reserve's Valuation-Adjusted Cross-Border Flows dataset (Bertaut & Tryon / Bertaut & Judson methodology)—which separates price changes (10Y UST yield jumps) from actual net buying/selling!
The #1 Institutional Insight: FX-Hedged Foreign Bond Buying Creates ZERO Net Spot USD Demand!#
Pause and trace the cash flows when a Japanese life insurer in Tokyo (USD/JPY carry & TONA hedging) or a German insurer in Frankfurt (EUR/USD €STR-SOFR basis) buys $10 billion of 10-year US Treasuries on an FX-hedged basis:
- Leg 1: The insurer buys $10B Spot USD against JPY (or EUR) to pay for the 10-year US Treasury bond.
- Leg 2 (Simultaneous 3-Month FX Swap!): To eliminate currency risk, the insurer executes a Buy-Sell FX Swap—SELLING $10B Spot USD today and buying $10B 3-month forward (actually bundling Step 1 + Step 2 so the spot legs cancel 100% on the dealer's desk!)!
- Net Spot FX Impact = $0.00! All $10B shows up as "Foreign Private Buying of US Treasuries" in the TIC report, yet it only moved 3-month XCCY swap points—NOT spot USD!
| TIC Cross-Border Flow Line Item | Typical Foreign Buyer Cohort | Typical FX Hedge Ratio | True Net Spot USD Impact per $10B TIC Inflow |
|---|---|---|---|
| Official Foreign USTs (FOI) | Central banks (IMF COFER: BoJ, SAFE, MoF) | 0% Hedged (Held as USD FX reserves!) | +$10.0B Direct Spot USD Support (Sales = intervention!) |
| Private Foreign USTs | Cayman RV hedge funds + JP/EU insurers | 70% – 95% FX-Hedged / Repo-Funded! | +$0.5B to +$2.5B (Mostly repo basis & swap-hedged!) |
| US IG Corporate Bonds | Taiwan lifers, European insurers, Asia pensions | 45% – 65% FX-Hedged | +$3.5B to +$5.5B moderate spot USD demand |
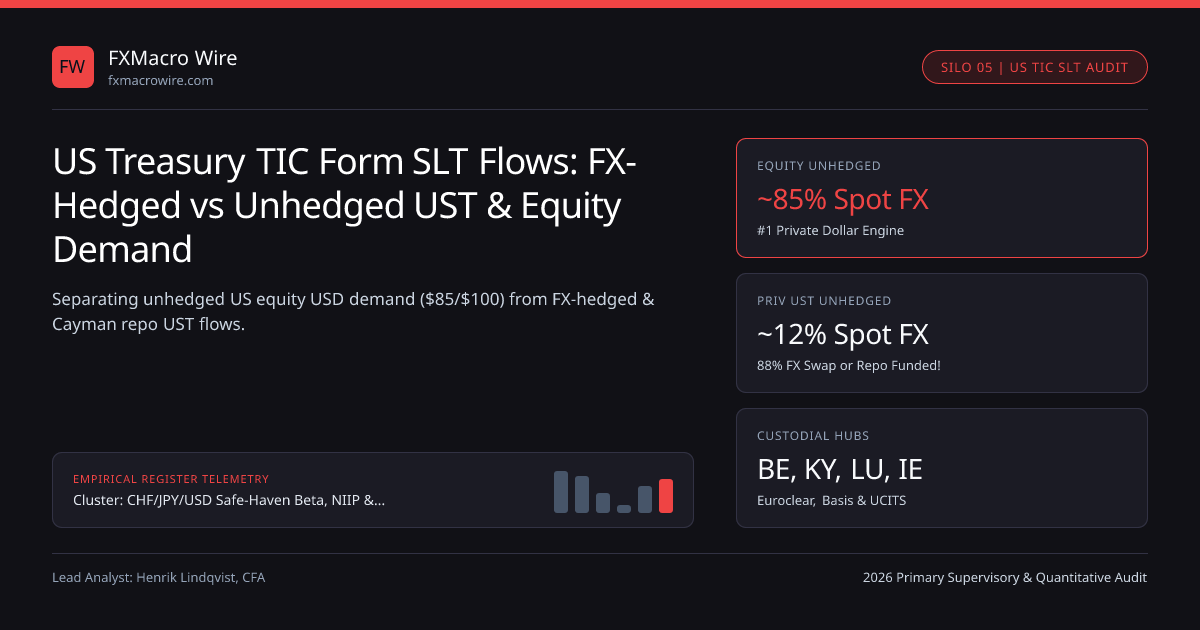
| US Equities (S&P / Nasdaq) | Global pensions (NPS, GPIF, NBIM) & retail ETFs | 5% – 20% Hedged (~85% UNHEDGED!) | +$8.0B to +$9.5B MASSIVE Spot USD Demand!! |
Quantitative TIC Net Spot USD Impulse Formula (Valuation + Hedge-Adjusted)#
Institutional G10 quant desks convert monthly TIC Form SLT stock changes (Ht - H{t-1}) into True Unhedged Net USD Spot Flow (USDSpotFlow_t) using the Federal Reserve's valuation adjustment and empirical asset-class hedge weights (1 - h_k):
- USDSpotFlowt = SUM{k in [OfficialUST, PrivUST, Corp, Equity]} ( 1 - HedgeRatiok ) * ActiveFlow{k,t}
- Worked Monthly TIC Report Translation (Headline Print: "+$60B Foreign UST Buying, -$25B Foreign US Equity Selling"):
- Naive Retail Read: "+$35B net TIC inflow -> Bullish USD!"
- Institutional Hedge-Adjusted Reality:
- 1. +$60B Private Cayman/Insurer UST Buy (88% FX/Repo Hedged -> 12% unhedged): +$60B * 0.12 = +$7.2B Spot USD
- 2. -$25B Foreign US Equity Sale (15% Hedged -> 85% unhedged!): -$25B * 0.85 = -$21.25B Spot USD!
- > True Net Spot USD Flow = +$7.2B - $21.25B = -$14.05 Billion NET SPOT USD SELLING! (Bearish USD!)
Decoding "Custodial Bias": Belgium (Euroclear), Cayman Islands, Luxembourg & Ireland!#
Never take country labels in monthly TIC tables literally without checking custodial center geography:
- Belgium (Euroclear Brussels, ~$350B+ USTs): Holds offshore sovereign reserve custody accounts (historically including Chinese SAFE offshore tranches and Middle Eastern reserve managers!).
- Cayman Islands (~$400B+ USTs): Not Caribbean retirees—100% domiciled master funds of New York and London relative-value hedge funds financing long cash US Treasuries via overnight repo against short CME Treasury futures (zero net USD FX exposure!)!
- Luxembourg (CSSF) & Ireland (CBI): Domiciles for global UCITS ETFs and mutual funds bought by European, Asian, and Latin American investors! Every April, the Annual TIC Benchmark Survey (as of June 30) re-attributes custodial holdings back to true residence!
Connecting TIC Equity Dominance to US Fiscal Sustainability#
Notice how this TIC decomposition unlocks both our safe-haven FX & BoP hub guide, Right-Wing Dollar Smile US equity exceptionalism, and how private hedged UST buyers fund US fiscal deficits without lifting DXY across our safe-haven FX & capital-flow regimes hub!
Frequently asked questions
Why did Japan’s reported TIC US Treasury holdings drop during periods when BoJ didn’t intervene?
Because TIC Form SLT reports market value! Whenever 10-year US Treasury yields rise +50 bps, the market price of Japan’s $1.1T bond portfolio drops by ~$35B automatically even if Tokyo sold zero bonds.
Why do foreign investors leave 80%-85% of their US equity holdings FX-unhedged?
Under the Dollar Smile, USD typically strengthens when the S&P 500 crashes in global risk-off episodes—giving foreign pension funds (such as Korea’s NPS, Japan’s GPIF, and European UCITS) a free natural volatility buffer in local currency.
Why do the Cayman Islands rank among top foreign holders of US Treasury securities in TIC?
Master funds of multi-strategy and fixed-income relative-value hedge funds are legally domiciled in the Cayman Islands; they hold hundreds of billions in cash USTs financed in US repo against short Treasury futures.
Where can analysts find TIC flows already stripped of bond and stock price valuation effects?
Federal Reserve economists publish the updated "Bertaut-Judson / Bertaut-Tryon" monthly valuation-adjusted cross-border portfolio flows dataset in the Federal Reserve IFDP Note series.
Publication record
- Published
- 13 November 2026
- Updated
- 14 November 2026
- Author
- Henrik Lindqvist, CFA
- Review
- Review not recorded
- Automated fact check
- Passed in the stored pipeline record
- Source URLs
- 3 recorded
AI assistance recorded: anthropic/claude-opus-4.6. This field does not establish human review or source verification.
Academic & Institutional Attribution
Cite This Research & Embed Live Data Card
Standard academic & institutional research paper citation format.
Henrik Lindqvist, CFA. (2026, November 14). US Treasury TIC Form SLT Flows: FX-Hedged vs Unhedged UST & Equity Demand. FXMacro Wire. https://fxmacrowire.com/wire/us-tic-slt-portfolio-flows-hedged-treasury-demandRelated Safe Haven Capital Flow Regimes & Institutional Briefings
Explore Safe Haven Capital Flow Regimes Hub (20) →Safe Haven Capital Flow Regimes
G10 Safe-Haven FX Beta, NIIP & Balance-of-Payments Capital Flow Guide (2026)Safe Haven Capital Flow Regimes
Broad Basic Balance (BBoP): Current Account + Net FDI as a G10 FX AnchorSafe Haven Capital Flow Regimes
Swiss Franc Real Safe-Haven Math: +9.5% Pharma Surplus, CPI Gap & EUR/CHFSafe Haven Capital Flow Regimes
Japan’s Structural Yen Drag: Digital Deficit, Energy Bill & Unrepatriated FDISafe Haven Capital Flow Regimes
Month-End WMR 16:00 London Fix: Equity-FX Hedge Rebalancing SignalsSafe Haven Capital Flow Regimes
Eurozone TARGET2 (T2) Balances: Reading Intra-Euro Capital Flight & EUR/USDSafe Haven Capital Flow Regimes
US Exorbitant Privilege & NIIP Valuation Effects Across Dollar CyclesSafe Haven Capital Flow Regimes
Energy Supply Shocks & the Safe-Haven Flip: Why JPY & EUR Broke in StagflationMarket Insights
Cash and the digital euro - two sides of the same coinRegulatory Compliance
Foundations for innovative and resilient capital marketsMonetary Policy
Why Bank of England's Lombardelli Thinks a December Rate Rise is in Play - Pound Sterling LiveMarket Insights
BUK250N Index Price - CBOE UK250 - FOREX.com
FXMacro Wire Data, Benchmarks & Contributor Records
CC BY 4.0 Open Data
Open Institutional Datasets (CSV / JSON) →
Download desk-compiled quantitative series & schemas.
2026 Reference Matrix
2026 Institutional Benchmarks & Thresholds →
Statutory capital, clearing, margin & rate conventions.
Editorial Records
Authors & Review Records →
View named contributors where those records are available.
Complete Index
Master Research & Dossier Archive →
Browse all published briefings by topic pillar & date.