
Safe Haven Capital Flow Regimes
Japan’s Structural Yen Drag: Digital Deficit, Energy Bill & Unrepatriated FDI
On paper, Japan posts record ¥25+ trillion annual current-account surpluses—yet in actual cash foreign exchange markets, a surging ¥6.5 trillion US cloud/streaming "Digital Deficit," fossil-fuel imports, and unremitted overseas FDI turned Tokyo into a net spot dollar buyer.
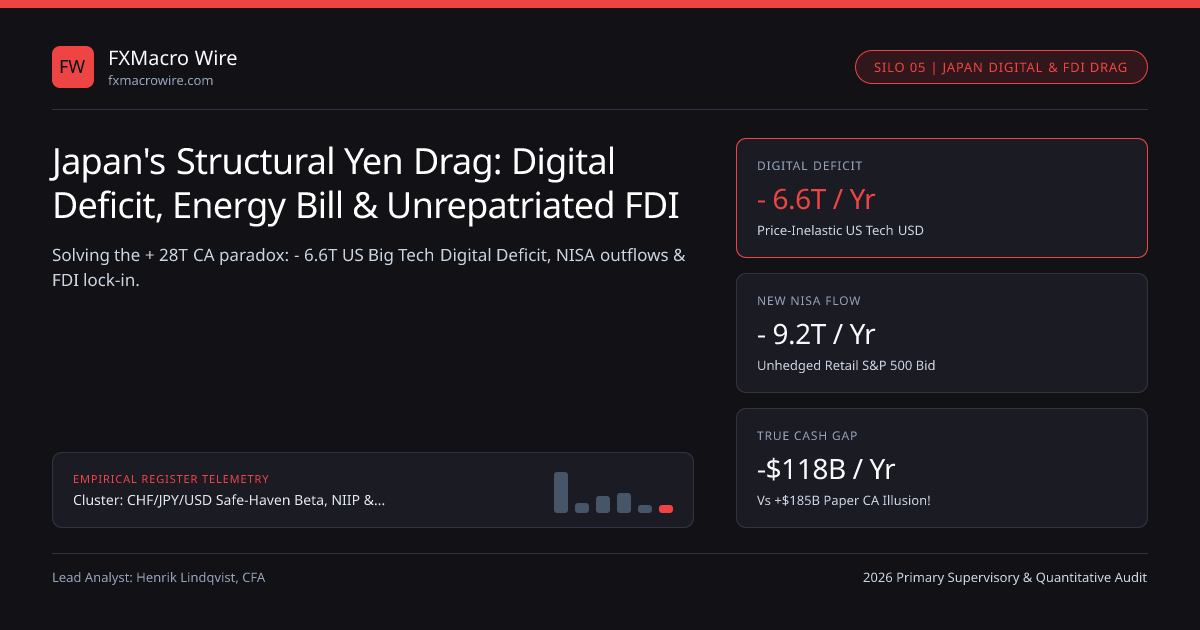
Between 2022 and 2026, Japan's Ministry of Finance reported all-time record Current Account surpluses exceeding ¥25 trillion to ¥29 trillion (~$175B–$195B/year, ~4.6% of GDP)—yet FinDB's USD/JPY Carry & TONA Benchmark (USDJPY-CARRY-TONA 2026 Standard) traded near 35-year lows between 145 and 160!
Why didn't ¥28 trillion of external surplus lift the Japanese yen? Because Japan's Current Account underwent a profound structural hollowing-out audited closely by global G10 FX desks (ECB, BCBS / BIS, BaFin, routing institutional JPY flow across Blocksize Capital, Bequant, and CMC Central): 100%+ of Japan's surplus comes from Primary Investment Income (¥36T–¥40T/yr, over half of which NEVER converts into yen!), while actual cash Goods + Digital Services bleed relentless, price-insensitive spot USD buying every single business day!
Cash Bleed #1: Japan's Exploding ¥6.5+ Trillion "Digital Deficit" to US Big Tech!#
Ten years ago, Japan's services balance was dominated by outbound vs inbound tourism (now a +¥5.5T inbound tourism surplus thanks to 36M+ foreign visitors!). Today, almost the entire inbound tourism windfall is eaten alive by Japan's structural "Digital Deficit" (~ -¥6.2T to -¥7.0T/year, ~$45B/yr and growing 15% annually!):
- Japanese corporations and households pay monthly US dollar subscriptions, cloud-computing AWS/Azure/GCP fees, AI API tokens, digital ad spend (Google/Meta), enterprise SaaS licenses, and streaming royalties directly to US tech headquarters!
- Unlike auto exports or carry trades, AWS cloud bills and enterprise SaaS subscriptions have ZERO exchange-rate elasticity: Japanese firms must sell JPY and buy USD every month whether USD/JPY is at 110 or 158!
Cash Bleed #2: Unrepatriated Foreign FDI + "New NISA" Household Capital Flight!#
Pair the Digital + Energy cash trade deficit with two relentless Financial Account outflows:
- Unrepatriated Corporate FDI (Primary Income Illusion): Following the 2011 Fukushima nuclear shutdown and strong-yen era, Japanese industrial giants moved factories permanently to North America and ASEAN. Today, over ¥18T–¥22T of Japan's ¥38T Primary Income consists of foreign subsidiary profits and foreign bond coupons automatically reinvested in USD/EUR abroad (IMF BPM6 cash Basic Balance adjustment)!
- Expanded Tax-Free "New NISA" Retail Outflows (Launched Jan 2024): Unlocking lifetime tax-free investment allowances prompted millions of Japanese households to set up automated monthly payroll purchases (Tsumitate) into unhedged "eMAXIS Slim All-Country (Orkan)" and S&P 500 mutual funds—creating ~$6B to $8B EVERY SINGLE MONTH of price-insensitive retail spot USD/JPY buying!
| Japanese BoP Component | Headline BPM6 Accounting (¥T/yr) | Estimated Cash FX Conversion % | True Spot JPY Market Flow (¥T/yr) | Macro Sensitivity |
|---|---|---|---|---|
| Primary Investment Income | +¥38.2T (Record high!) | Only ~32% repatriated into JPY! | +¥12.2T actual JPY buying | Coupons roll right back into USTs/Credit |
| Merchandise Trade (Energy vs Autos) | -¥4.8T (Fossil fuel drag) | 100% Cash FX Settled! | -¥4.8T cash JPY selling | Highly sensitive to Brent & Asian JKM LNG |
| Digital Services vs Tourism | -¥2.6T (-¥6.6T Tech + +¥5.5T Travel - Other) | 100% Cash FX Settled! | -¥2.6T cash JPY selling | Digital deficit grows ~15%/yr secularly! |
| Net Outbound Cash FDI + New NISA | -¥19.5T Financial Account | ~95% Unhedged Spot FX! | -¥18.5T cash JPY selling! | Flips net autonomous cash flow to -¥13.7T/yr! |
Quantitative Cash-Adjusted Japanese Yen Flow Identity#
Walk through the exact arithmetic conducted by Tokyo G10 FX strategists at Mitsubishi UFJ / Nomura / BoJ research desks to compute Japan's True Monthly Structural Cash FX Deficit:
- TrueCashFlowJPY = GoodsTrade + ServicesNet + ( RepatriationShare * PrimaryIncome ) - NetCashOutwardFDI - UnhedgedNISAEquities
- Worked 2026 Annual Japanese Yen Structural Flow Audit (in Trillions of Yen, @ USD/JPY = 150 -> ¥15T = $100B):
- 1. Headline Paper Current Account = -4.8 (Goods) - 2.6 (Services) + 38.2 (Primary Income) - 2.8 (Transfers) = +¥28.0 Trillion Surplus!
- 2. Deduct Non-Repatriated Income = - (0.68 * 38.2) = -¥26.0T stays in USD/EUR -> Cash Current Account is barely +¥2.0T!
- 3. Deduct Cash FDI (-¥10.5T) + Unhedged Retail NISA/Toshin (-¥9.2T) = -¥19.7T outflow!
- > Net Autonomous Cash Yen Balance = +¥2.0T - ¥19.7T = -¥17.7 Trillion (-$118 Billion/yr structural spot JPY selling!!)
What CAN Flip Japan's Cash FX Flow Bullish for the Yen?#
Does a -¥17.7T structural cash deficit mean USD/JPY can never fall? No—two powerful cyclical switches override structural corporate outflows instantly:
- US Rate Cuts Compressing US-Japan Hedging Costs (< 2.50%): Once Fed cuts + BoJ hikes narrow the 3-month SOFR-TONA spread from 500 bps below 275 bps, Japanese life insurers (¥390T AUM, currently only ~45% FX-hedged!) raise FX hedge ratios from 45% back toward 65%—selling $150B+ of USD/JPY forwards in a single year, overwhelming the entire -¥17.7T cash deficit!
- Domestic Nuclear Reactor Restarts + Falling Brent/JKM LNG: Every restarted Japanese nuclear GW permanently slashes imported fossil-fuel USD demand (energy import safe-haven flip)!
Synthesizing Structural Cash Drag vs Cyclical US Yield Beta#
That tug-of-war explains modern USD/JPY asymmetry across our safe-haven FX & BoP hub guide and creditor NIIP dynamics: dips in USD/JPY meet persistent corporate Digital/Energy + retail NISA buying whenever US yields stabilize, while sharp drops in US 10Y yields unleash violent lifer hedge-ratio & carry short-covering rallies across our safe-haven FX & capital-flow regimes hub!
Frequently asked questions
What is Japan’s "Digital Deficit" in foreign exchange analysis?
Measured inside the Ministry of Finance Services Balance (telecommunications, computer/cloud, R&D/licensing, and digital advertising), Japan’s Digital Deficit exceeds -¥6.6 trillion (~$44B) annually paid mostly to US technology firms.
How did Japan’s 2024 "New NISA" reform weaken the Japanese yen?
Tripling annual tax-free retail investment caps led Japanese households to pour ~¥9T-¥12T/year into foreign-equity Toshin mutual funds (overwhelmingly unhedged S&P 500 and MSCI ACWI), generating steady monthly spot USD buying.
Why don’t Japanese corporations bring their ¥38 trillion of overseas Primary Income back into yen?
Because Japan’s domestic population is shrinking while overseas North American, Indian, and ASEAN markets are growing, Japanese multinationals rationally reinvest overseas USD profits directly into foreign factories and M&A.
Why does inbound tourism to Japan show up as a genuine cash yen purchase?
Foreign tourists physically swipe credit cards or exchange foreign banknotes to pay Tokyo hotels, railways, and retailers in yen—generating +¥5.5T+/yr of 100% cash-settled JPY demand.
Publication record
- Published
- 13 November 2026
- Updated
- 15 November 2026
- Author
- Henrik Lindqvist, CFA
- Review
- Review not recorded
- Automated fact check
- Passed in the stored pipeline record
- Source URLs
- 3 recorded
AI assistance recorded: anthropic/claude-opus-4.6. This field does not establish human review or source verification.
Academic & Institutional Attribution
Cite This Research & Embed Live Data Card
Standard academic & institutional research paper citation format.
Henrik Lindqvist, CFA. (2026, November 15). Japan’s Structural Yen Drag: Digital Deficit, Energy Bill & Unrepatriated FDI. FXMacro Wire. https://fxmacrowire.com/wire/japan-digital-energy-deficit-fdi-reinvestment-jpyRelated Safe Haven Capital Flow Regimes & Institutional Briefings
Explore Safe Haven Capital Flow Regimes Hub (20) →Safe Haven Capital Flow Regimes
G10 Safe-Haven FX Beta, NIIP & Balance-of-Payments Capital Flow Guide (2026)Safe Haven Capital Flow Regimes
Month-End WMR 16:00 London Fix: Equity-FX Hedge Rebalancing SignalsSafe Haven Capital Flow Regimes
Eurozone TARGET2 (T2) Balances: Reading Intra-Euro Capital Flight & EUR/USDSafe Haven Capital Flow Regimes
US Exorbitant Privilege & NIIP Valuation Effects Across Dollar CyclesSafe Haven Capital Flow Regimes
Energy Supply Shocks & the Safe-Haven Flip: Why JPY & EUR Broke in StagflationSafe Haven Capital Flow Regimes
UK Twin Deficits & 31.4% Foreign Gilt Share: Modeling Sterling’s Risk BetaSafe Haven Capital Flow Regimes
CFTC TFF FX Positioning: Leveraged Funds vs Asset Managers & Pain TradesSafe Haven Capital Flow Regimes
Global M2 Liquidity Impulse & Central Bank Reserves: High-Beta AUD, NZD & SEKMarket Insights
BUK250N Index Price - CBOE UK250 - FOREX.comMarket Insights
Sterling drops against firmer dollar as markets price in a hawkish Fed - Euronext Markets: Real-time Stock Market Data | liveRegulatory Compliance
Revolut Secures ECB Approval for Major European Restructuring and French Expansion - FF NewsDigital Currency
ECB warns legislative delays could postpone digital euro launch
FXMacro Wire Data, Benchmarks & Contributor Records
CC BY 4.0 Open Data
Open Institutional Datasets (CSV / JSON) →
Download desk-compiled quantitative series & schemas.
2026 Reference Matrix
2026 Institutional Benchmarks & Thresholds →
Statutory capital, clearing, margin & rate conventions.
Editorial Records
Authors & Review Records →
View named contributors where those records are available.
Complete Index
Master Research & Dossier Archive →
Browse all published briefings by topic pillar & date.