
Safe Haven Capital Flow Regimes
CFTC TFF FX Positioning: Leveraged Funds vs Asset Managers & Pain Trades
Most currency commentators quote the legacy CFTC "Non-Commercial Speculator" net total—lumping fast-money CTA hedge funds together with structural pension currency hedges! Separating CFTC Traders in Financial Futures (TFF) cohorts unlocks institutional positioning alpha.
Every Friday at 15:30 ET, the US Commodity Futures Trading Commission releases weekly Commitments of Traders (COT) open-interest data (as of Tuesday's market close) across CME Group's ~$100B+/day listed FX futures complex (EUR, JPY, GBP, AUD, CAD, CHF, NZD, MXN, BRL).
Ninety percent of financial media charts the Legacy COT "Non-Commercial (Speculator)" line—and routinely gets burned! Why? Because the 1980s Legacy report lumps fast-money trend-following CTAs and macro hedge funds into the exact same bucket as $5 trillion real-money institutional bond/equity mutual funds executing structural passive FX hedges! Institutional quant desks regulated under ECB, IOSCO, and BaFin standards (trading across Blocksize Capital, Bequant, and CMC Central) ignore Legacy COT completely and dissect the disaggregated CFTC Traders in Financial Futures (TFF) report across four distinct institutional cohorts!
Inside the 4 CFTC TFF Cohorts: Why Asset Managers & Leveraged Funds Often Take OPPOSITE Sides!#
Look at what actually sits inside each of the four TFF columns every Friday afternoon:
- Dealer / Intermediary (Sell-Side Banks): Prime banks warehousing OTC FX forward/swap flow from corporate and hedge-fund clients and offsetting their net delta on CME IMM futures! (Crucial clue: if Leveraged Funds aren't extreme on CME, check if Dealer net positions flipped—reflecting huge OTC hedge-fund trades off-exchange!)
- Asset Manager / Institutional (Real Money — Pensions, Mutual Funds, Insurers): Frequently structural passive hedgers! For example, European and global bond funds owning US corporate bonds sell USD / buy CME EUR futures (+250,000 contracts structurally long EUR!) NOT because they are "bullish Euro," but to currency-hedge their US credit portfolios!
- Leveraged Funds (Fast Money — Macro Hedge Funds, CTAs, Commodity Pool Operators): Pure alpha-seeking directional speculators with tight stop-losses and VaR limits! THIS is the fast-money cohort that capitulates violently in positioning squeezes!
- Other Reportables: Large corporate treasuries and uncategorized proprietary family offices.
Cohort Behavior & Signal Horizon Matrix Across CME G10 Futures#
Notice the dramatic contrast between Trend-Following Momentum (Asset Manager inflections) and Contrarian Capitulation (Leveraged Fund >2.2 SD extremes):
| CFTC TFF Cohort | Typical Holding Horizon | Structural Baseline Bias | Signal Type When Extreme ( | Z | > 2.0) | Classic Misinterpretation |
|---|---|---|---|---|---|---|
| Leveraged Funds (CTAs / Pods) | 1 week to 3 months | Zero (flips +/-100% rapidly) | Contrarian Squeeze Alert once spot breaks 20D MA! | Fading | Z | =2.0 before price momentum turns (gets run over!) |
| Asset Managers (Real Money) | 6 months to 3+ years | Structurally Long EUR, Short USD/CAD | Slow turning points confirm multi-quarter regime shifts | Calling EUR "crowded long" just because AMs hold +200k hedges! | ||
| Dealer / Intermediary | Matched warehouse book | Opposite of OTC client net demand | Inverse proxy for OTC FX forwards not traded on CME | Thinking Wall Street dealers are taking proprietary directional bets | ||
| Options-Adjusted TFF (Combined) | 1M – 6M IMM expiries | Captures deep OTM macro call/put structures | Detects hidden macro option gamma walls ahead of CPI/FOMC | Reading futures-only TFF when macro funds express views via options! |
Quantitative Open-Interest-Adjusted Z-Score & Pain-Trade Trigger Formula#
Never compare raw contract counts from 2015 against 2026 (total CME FX open interest grew substantially, and contract sizes vary: €125,000 per EUR contract vs ¥12,500,000 [~$83k] per JPY contract!). Institutional quants normalize Options-Inclusive Leveraged Fund Net Positioning as a % of Total Open Interest (PctOIt), convert to a 156-Week (3-Year) Rolling Z-Score, and gate entry with a Volume-Weighted Average Entry Price (VWAP_Crowd) underwater check:
- ZLev156Wt = ( PctOILevt - Mean156W(PctOILev) ) / StdDev156W(PctOILev)
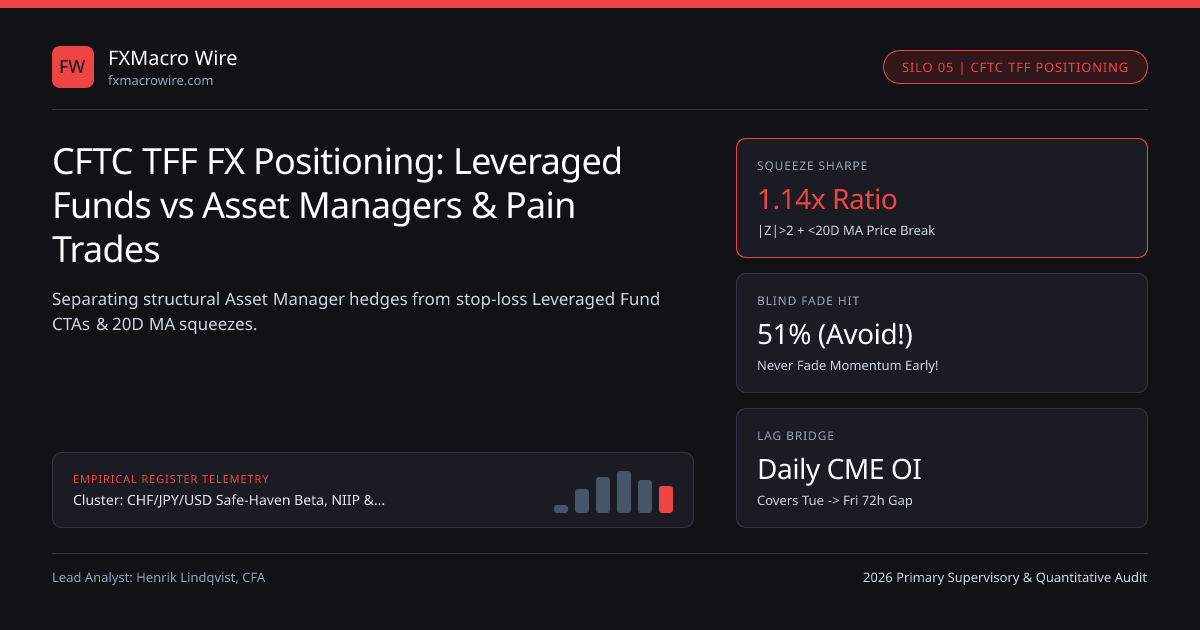
- SqueezeSignalt = - sign(ZLev156Wt) IF |ZLev156Wt| >= 2.05 AND SpotReturnvs20DMA * sign(ZLev156Wt) < -1.0%
- Worked July/August 2024 CME Japanese Yen Squeeze Case Study:
- 1. Early July 2024: Leveraged Funds + Asset Managers combined Net Short JPY hit -184,000 contracts (-48% of OI -> Z_156W = -2.65 SD!!)
- 2. Estimated Crowd Entry VWAP on Latest 60k Short Tranche = 157.80 USD/JPY.
- 3. July 11-31: Soft US CPI + MoF strike + BoJ hike pushed Spot USD/JPY below 20D MA (156.20) -> 100% of late shorts UNDERWATER!
- 4. Squeeze Signal Fires SHORT USD/JPY @ 155.50 -> Forced CTA covering drove USD/JPY straight to 141.70 (-1,380 pips in 3 weeks!!)
Bridging the Tuesday-to-Friday 72-Hour Blind Spot!#
What if a violent FOMC meeting or US CPI print happened on Wednesday or Thursday—rendering Friday's Tuesday-cutoff CFTC report partially stale? Institutional desks pair Friday's TFF report with two T+0 daily supplements:
- CME Daily Preliminary Open Interest (Published 02:00 CT every morning!): If spot USD/JPY dropped -250 pips on Wednesday AND total CME JPY Open Interest fell by -28,000 contracts overnight, you know short-covering liquidation is already 35% underway (versus Rising Open Interest = fresh longs entering!)!
- DTCC SDR Options Trade Repository (Real-time OTC FX Option Trades): Tracks live $100M+ institutional strikes hitting 25-delta risk reversals intraday!
Synthesizing Positioning Hygiene With Fundamental BoP & Dollar Smile Signals#
Positioning is fuel, never the spark! Across our safe-haven FX & BoP hub guide, Dollar Smile macro quadrants, and NIIP safe-haven dynamics, institutional PMs use CFTC TFF Z-scores strictly to asymmetric-size macro convictions: betting 1.5x size when strong fundamentals meet clean/opposite Leveraged Fund positioning, and tightening stops whenever |Z_Lev| exceeds 2.2 SD in our favor across our safe-haven FX & capital-flow regimes hub!
Frequently asked questions
What is the difference between the Legacy COT report and the TFF report in FX?
Introduced in 2009 specifically for financial contracts, the Traders in Financial Futures (TFF) report splits financial institutions into Dealers, Asset Managers (pensions/mutual funds), Leveraged Funds (hedge funds/CTAs), and Other Reportables.
Does CFTC CME futures positioning capture the entire $9.6 trillion OTC FX market?
CME FX futures represent ~$100B+/day (~5%-8% of spot/forward directional turnover), but correlate >0.82 with broader prime-brokerage CTA indices because systematic trend funds execute across both IMM futures and OTC ECNs simultaneously.
Why should analysts use "Futures-and-Options Combined" TFF rather than "Futures-Only"?
Discretionary macro hedge funds frequently express large currency views via 1-to-3-month FX call/put options; the CFTC delta-weights those options into equivalent futures contracts inside the Combined TFF report.
What happens to CFTC positioning data during March, June, September, and December IMM roll weeks?
During the week preceding the third Wednesday of March, June, September, and December, gross open interest swells temporarily via calendar spread rolls before dropping sharply on expiration day—making % of OI normalization essential.
Publication record
- Published
- 13 November 2026
- Updated
- 14 November 2026
- Author
- Henrik Lindqvist, CFA
- Review
- Review not recorded
- Automated fact check
- Passed in the stored pipeline record
- Source URLs
- 3 recorded
AI assistance recorded: anthropic/claude-opus-4.6. This field does not establish human review or source verification.
Academic & Institutional Attribution
Cite This Research & Embed Live Data Card
Standard academic & institutional research paper citation format.
Henrik Lindqvist, CFA. (2026, November 14). CFTC TFF FX Positioning: Leveraged Funds vs Asset Managers & Pain Trades. FXMacro Wire. https://fxmacrowire.com/wire/cftc-tff-leveraged-funds-asset-manager-fx-positioningRelated Safe Haven Capital Flow Regimes & Institutional Briefings
Explore Safe Haven Capital Flow Regimes Hub (20) →Safe Haven Capital Flow Regimes
G10 Safe-Haven FX Beta, NIIP & Balance-of-Payments Capital Flow Guide (2026)Safe Haven Capital Flow Regimes
Global M2 Liquidity Impulse & Central Bank Reserves: High-Beta AUD, NZD & SEKSafe Haven Capital Flow Regimes
Cross-Border M&A Deal-Contingent FX Forwards: Pricing Regulatory Tail RiskSafe Haven Capital Flow Regimes
Solvency II 25% FX Capital Charge: Why European Insurers Hedge 95% of USDSafe Haven Capital Flow Regimes
FX 25-Delta Risk Reversals & Butterflies: Reading Safe-Haven Tail SkewSafe Haven Capital Flow Regimes
Sovereign Wealth Fund & Petrodollar Recycling: ADIA, PIF, QIA & NBIM FX FlowsSafe Haven Capital Flow Regimes
Post-NIRP Eurozone Bond Repatriation: Positive Bund Yields & Structural EUR SupportSafe Haven Capital Flow Regimes
US Fiscal Deficits, Term Premium & Private FX-Hedged UST Demand: Dollar EndgameMarket Insights
Singapore Central Bank Rolls Out Gold-Vaulting ServicesEarnings Reports
CJ CheilJedang Q3 2026 slides: sales rise 5.7%, FX losses hit profitMonetary Policy
Japan Spent Record $50 Billion in Single Day to Bolster YenMonetary Policy
A Democratic Senate majority would be the broadest check yet on the president’s efforts to control the central bank
FXMacro Wire Data, Benchmarks & Contributor Records
CC BY 4.0 Open Data
Open Institutional Datasets (CSV / JSON) →
Download desk-compiled quantitative series & schemas.
2026 Reference Matrix
2026 Institutional Benchmarks & Thresholds →
Statutory capital, clearing, margin & rate conventions.
Editorial Records
Authors & Review Records →
View named contributors where those records are available.
Complete Index
Master Research & Dossier Archive →
Browse all published briefings by topic pillar & date.