
G10 Central Bank Rate Divergence
FOMC Dot-Plot Neutral r-Star Drift & ICE U.S. Dollar Index (DXY) Beta
Upward migration in the FOMC Summary of Economic Projections median longer-run neutral dot—from 2.50% nominal toward 2.90%-3.125%—lifts 5Y5Y US OIS forwards and sustains DXY valuation near 103.85.
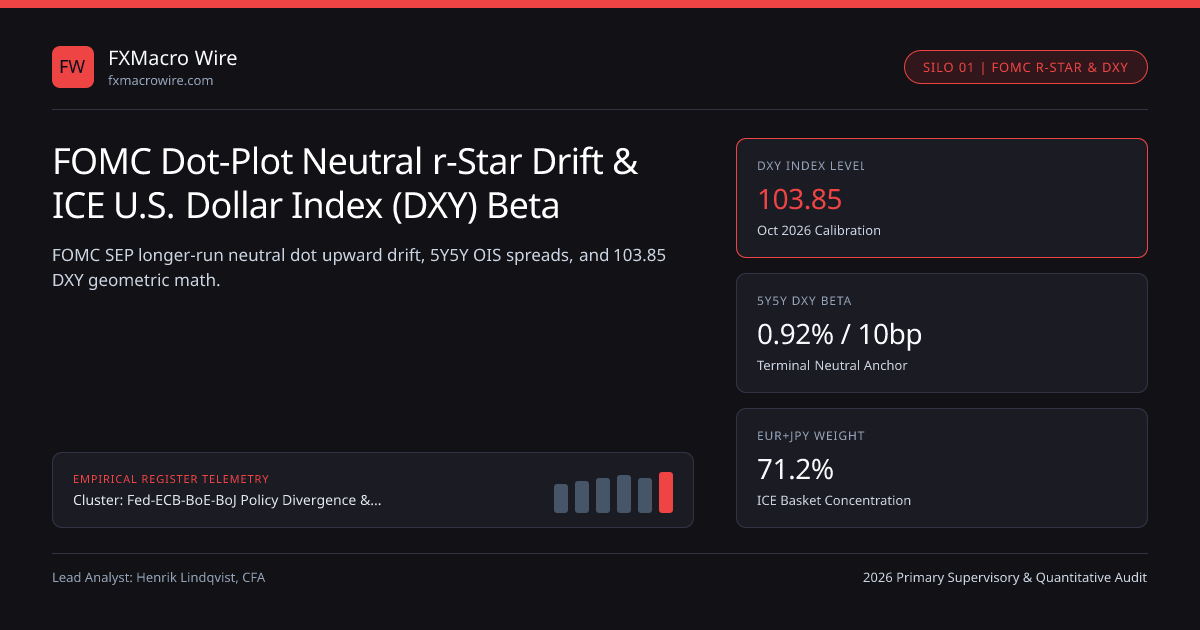
Upward migration in the Federal Open Market Committee (FOMC) Summary of Economic Projections (SEP) median longer-run neutral dot—climbing from a decade-long 2.50% nominal anchor toward 2.90% to 3.125%—exerts a powerful structural floor beneath ICE U.S. Dollar Index (DXY) trade-weighted valuation calibrated at 103.85. Whereas near-term FOMC calendar cuts shift 3-month and 1-year SOFR swaps transiently, revisions to the longer-run neutral real rate (r*) re-anchor 5-year-5-year forward US OIS rates relative to stagnant Eurozone and Japanese neutral benchmarks, preventing deep cyclical dollar bear markets.
Why 5Y5Y Neutral r-Star Divergence Outweighs Tactical Fed Cuts#
During classical easing cycles (2001, 2007, 2019), market pricing assumed FOMC cuts would carry Federal Funds all the way back to or below 2.00%, collapsing the entire US yield advantage across 1-year through 10-year tenors. In 2025-2026, heavy US federal borrowing (~6% of GDP), capital-intensive data-center investment, and resilient household net worth pushed market-implied 5Y5Y US OIS forwards toward 3.65% to 3.90%—more than 130 bps above Eurozone 5Y5Y ESTR forwards (~2.35%).
Within our G10 central bank rate divergence hub, decomposing DXY returns into front-end cutting cycles (SOFR 1Y - SOFR Spot) versus terminal-anchor shifts (5Y5Y US - 5Y5Y G6) explains why tactical dollar selloffs repeatedly stall around 100.50-101.50 DXY whenever quarterly SEP releases show wider dispersion in the top quartile of longer-run dots.
ICE DXY Fixed 1973 Currency Weights vs Fed H.10 Broad Dollar Trade Reality#
Institutional FX allocators must distinguish between the traded ICE DXY futures basket and the Federal Reserve Board's H.10 Broad Trade-Weighted Dollar Index. ICE DXY assigns static weights frozen after euro introduction: Euro (57.6%), Japanese Yen (13.6%), British Pound (11.9%), Canadian Dollar (9.1%), Swedish Krona (4.2%), and Swiss Franc (3.6%)—completely excluding China, Mexico, Taiwan, and South Korea, which represent over 46% of modern US goods trade!
Consequently, DXY behaves almost as an invertedleveraged proxy for EUR/USD ESTR-SOFR differentials (57.6% weight) plus USD/JPY (13.6% weight)—connecting directly to EUR/USD 2-year OIS spread elasticity and Taylor-rule FX fair-value gaps. European wealth and execution desks supervised by CSSF Luxembourg and BaFin, routing institutional FX futures and spot overlays via BFB Capital and Apex Capital, hedge broad trade-tariff shocks in USD/MXN and USD/CNH while reserving DXY exclusively for G6 central-bank r* divergence.
| DXY Component Currency | ICE DXY Basket Weight | Fed H.10 Broad Goods Weight | Longer-Run Nominal Neutral Anchor | Contribution to 103.85 DXY Base |
|---|---|---|---|---|
Euro (EUR) | 57.6% | ~15.1% | 2.00% - 2.25% (ECB ESTR) | Primary anchor; low EU r* caps EUR |
Japanese Yen (JPY) | 13.6% | ~4.6% | 1.00% - 1.50% (BoJ TONA) | Wide terminal gap supports DXY |
British Pound (GBP) | 11.9% | ~2.7% | 3.00% - 3.25% (BoE SONIA) | High UK neutral offsets USD strength |
Canadian Dollar (CAD) | 9.1% | ~13.4% | 2.50% - 2.75% (BoC CORRA) | 5Y mortgage drag aids USD/CAD |
| SEK (4.2%) & CHF (3.6%) | 7.8% combined | ~2.4% combined | 2.00% SEK / 0.50% CHF (FINMA) | BFB Capital basket overlay legs |
Decomposing DXY Sensitivity Across Short-End Cuts and Terminal r-Star#
Under the DXY-DOLLAR-INDEX 2026 benchmark standard, exact geometric basket math combines with a two-factor OIS curve decomposition separating cyclical front-end slope (1Y OIS) from secular terminal neutral (5Y5Y OIS):
- Delta ln(DXYt) = beta{cyc} * Delta(SOFR^{1Y}t - G6OIS^{1Y}t) + beta{rstar} * Delta(SOFR^{5Y5Y}t - G6OIS^{5Y5Y}_t)
- Worked SEP Release Scenario (-20 bps Dovish 1Y Cut Pricing + +15 bps Higher Longer-Run 5Y5Y r*):
- Empirical slopes (per 10 bps): beta{cyc} = 0.58%, beta{rstar} = 0.92%
- Front-end cyclical drag = 0.58% * (-2.0) = -1.16%
- Terminal r-star support = 0.92% * (+1.5) = +1.38%
- Net DXY spot reaction = -1.16% + 1.38% = +0.22% (DXY edges up from 103.85 to 104.08 despite near-term cuts!)
Reading FOMC Dot-Plot Skewness Ahead of Median Shifts#
Because the FOMC longer-run dot reports the median of 19 participants, only two or three hawks migrating from 2.75% to 3.25% are needed to jump the headline median by 12.5 or 25 bps once the distribution skews right.
Portfolio Hedging Implications for Non-US Real-Money Allocators#
Higher US r* keeps global bond investors structurally under-hedged on USD assets because rolling 3-month FX forwards remains expensive even at the trough of the Fed cycle. Strategists tracking our G10 policy divergence research hub monitor the spread between the SEP mean dot and median dot every March, June, September, and December to front-run structural DXY support.
Frequently asked questions
What is r-star (r*) in the FOMC Summary of Economic Projections?
Real r-star is the theoretical short-term real interest rate that neither stimulates nor restricts economic growth at full employment; adding the Fed 2.0% PCE inflation target yields the nominal longer-run neutral dot published quarterly in the SEP.
Why did DXY stay resilient near 103.85 even after the Federal Reserve began cutting rates?
Foreign central banks (ECB, BoC, Riksbank, SNB) cut concurrently while the FOMC raised its longer-run neutral rate estimate, leaving the 5Y5Y US-versus-G6 terminal rate differential wide enough to attract unhedged capital inflows.
How does the ICE DXY formula differ from the Fed H.10 Trade-Weighted Dollar Index?
ICE DXY uses fixed geometric weights from six G10 currencies dominated 57.6% by the euro, whereas the Fed H.10 Broad Dollar Index updates bilateral trade weights annually across 26 advanced and emerging economies led by Mexico, China, Eurozone, and Canada.
Why do FX options desks watch dispersion across the 19 FOMC dots?
Wide dispersion (e.g., longer-run dots spanning 2.375% to 3.75%) increases uncertainty around future FOMC reaction functions, lifting 3-month and 6-month G10 FX implied volatility around CPI and payroll releases.
Publication record
- Published
- 14 November 2026
- Updated
- 14 November 2026
- Author
- Henrik Lindqvist, CFA
- Review
- Review not recorded
- Automated fact check
- Passed in the stored pipeline record
- Source URLs
- 3 recorded
AI assistance recorded: anthropic/claude-opus-4.6. This field does not establish human review or source verification.
Academic & Institutional Attribution
Cite This Research & Embed Live Data Card
Standard academic & institutional research paper citation format.
Henrik Lindqvist, CFA. (2026, November 14). FOMC Dot-Plot Neutral r-Star Drift & ICE U.S. Dollar Index (DXY) Beta. FXMacro Wire. https://fxmacrowire.com/wire/fomc-dot-plot-neutral-r-star-drift-dxy-dollar-betaRelated G10 Central Bank Rate Divergence & Institutional Briefings
Explore G10 Central Bank Rate Divergence Hub (20) →G10 Central Bank Rate Divergence
G10 Central Bank Policy Divergence & Two-Year OIS Spreads: 2026 Foreign Exchange GuideG10 Central Bank Rate Divergence
Swiss National Bank 0.00% Rate Floor, SARON-ESTR Spreads & EUR/CHF CapsG10 Central Bank Rate Divergence
GBP/EUR +125 bps SONIA-ESTR Spread & UK Services Wage PersistenceG10 Central Bank Rate Divergence
Bank of Japan JGB Rinban Tapering, Yield Curve Steepening & Yen ConvexityG10 Central Bank Rate Divergence
ECB 15 bps Operational Corridor Narrowing, ESTR Excess Liquidity & Euro FXG10 Central Bank Rate Divergence
Shadow Short Rates & Quantitative Tightening Hike Equivalents in G10 Spot FXG10 Central Bank Rate Divergence
Central Bank Meeting-Day Intraday FX Event Volatility & Term-Structure WeightsG10 Central Bank Rate Divergence
State-Contingent vs Calendar Forward Guidance: OIS Volatility & FX Pass-ThroughFX Swap Basis Dollar Funding
NY Fed FIMA Repo Facility vs Central Bank FX Swap Lines: Sovereign USD PlumbingFX Swap Basis Dollar Funding
CLS PvP Settlement Cutoffs & North American T+1 FX Swap Liquidity CompressionFX Swap Basis Dollar Funding
GBP/USD SONIA-SOFR FX Forwards & UK LDI Pension Hedging Roll MechanicsFX Swap Basis Dollar Funding
USD/CHF SARON-SOFR Basis & Post-Merger Swiss Bank Balance-Sheet Plumbing
FXMacro Wire Data, Benchmarks & Contributor Records
CC BY 4.0 Open Data
Open Institutional Datasets (CSV / JSON) →
Download desk-compiled quantitative series & schemas.
2026 Reference Matrix
2026 Institutional Benchmarks & Thresholds →
Statutory capital, clearing, margin & rate conventions.
Editorial Records
Authors & Review Records →
View named contributors where those records are available.
Complete Index
Master Research & Dossier Archive →
Browse all published briefings by topic pillar & date.